# Process Monitor
Process Monitor is a powerful analytics tool to enable business process owners and leadership to streamline processes and improve key metrics. By providing visual insights into your processes, Process Monitor helps you identify bottlenecks and optimize process flows to increase efficiency. Process Monitor works with minimal configuration to provide a full suite of metrics, charts, and graphical analysis tools for any active object or document lifecycle.
Built-in metrics and charts for KPIs related to cycle time, volume, and quality enable you to measure the direct impact of process changes, ensuring continuous improvement.
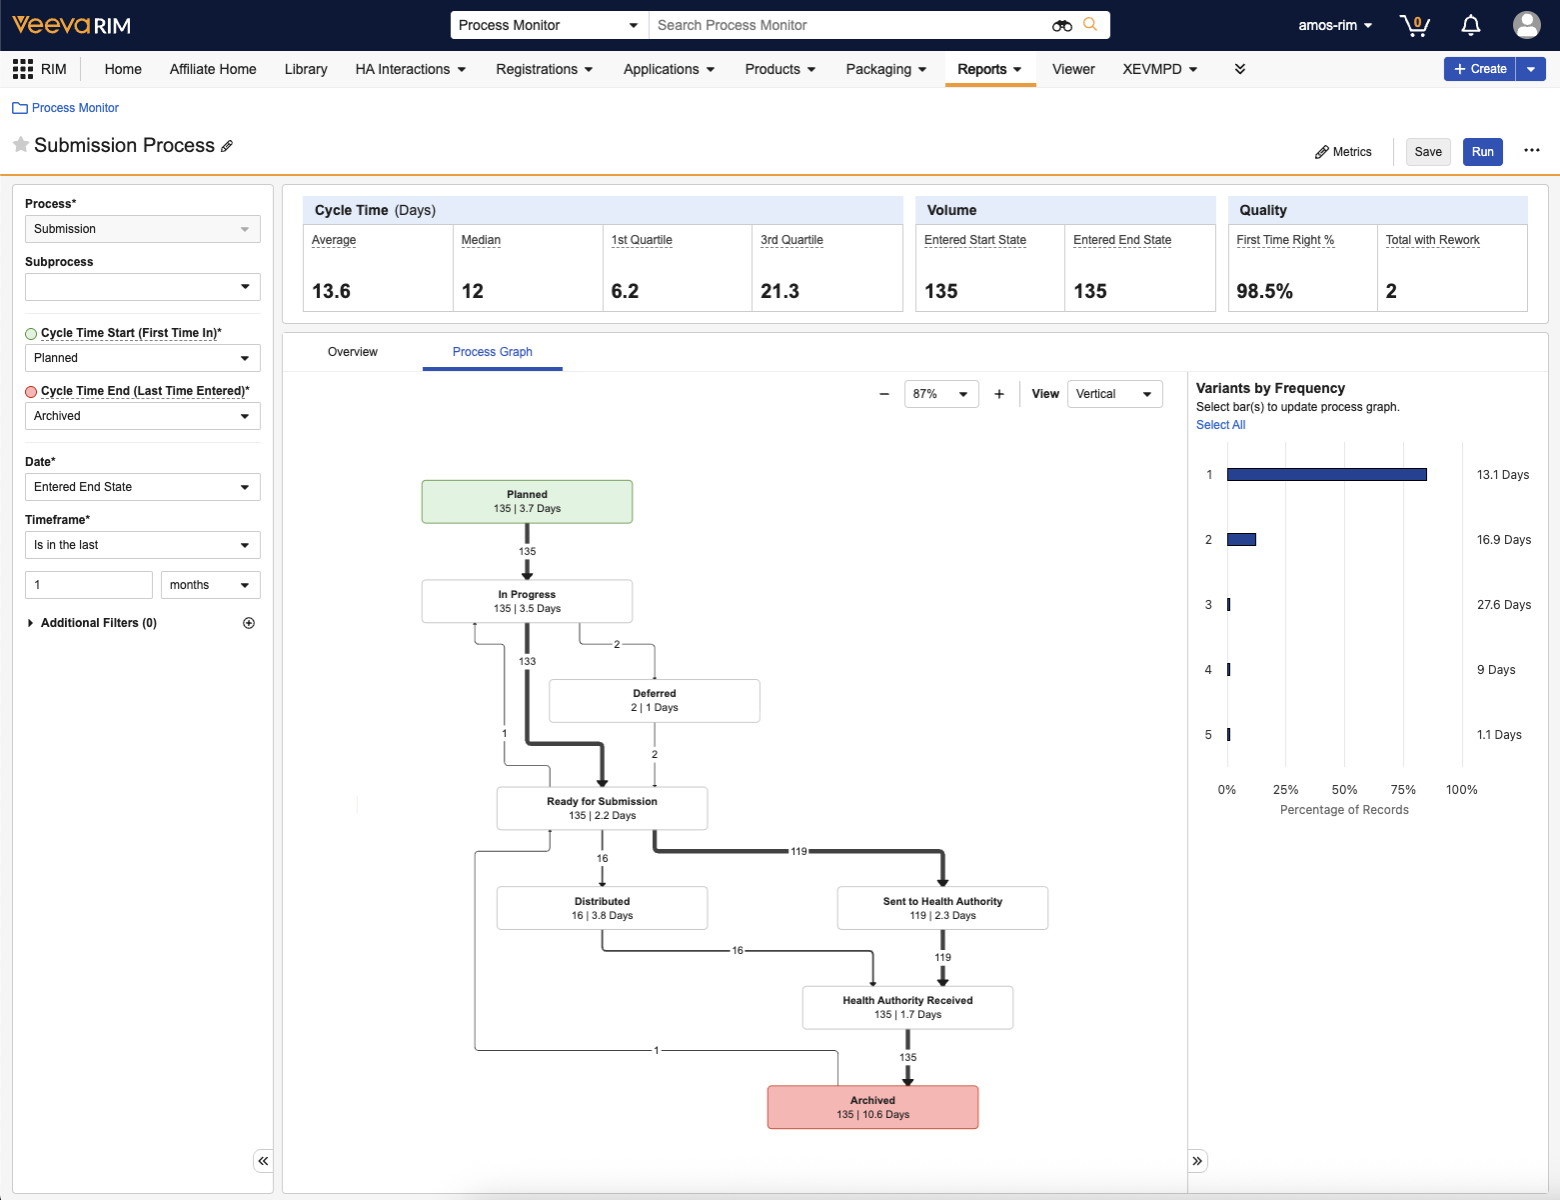
 The process graph allows you to trace workflows and identify inefficiencies through a visualization of the steps (lifecycle states) and paths (state-to-state transitions) that records or documents have taken. You can filter this graph using the _Variants by Frequency_ panel, which isolates the unique paths records and documents have traveled, allowing users to focus improvement efforts on the most common or problematic workflows.
 ## Accessing Process Monitor {#accessing-process-monitor}
In most Vaults, Process Monitor is added automatically to your existing tab configuration. Depending on your Vault's tab configuration, you can access Process Monitor by navigating to **Reporting > Process Monitor**, or by clicking **Process Monitor** directly on the navigation bar. If you need to modify access, you can add the Process Monitor tab to existing tab collections.
You must have the [necessary permissions][1] to view Process Monitor. In addition, Process Monitor is available in all application families except Clinical Data, CRM, and Align.
## Object & Document Processes
Process Monitor allows you to view various metrics about your organization's processes. These processes include both object lifecycles and document lifecycles.
### Object Lifecycles
You can select an object lifecycle in a Process View from the _Process_ drop-down, and then optionally select one or more object types that use that lifecycle from the _Subprocess_ drop-down. When running the Process View, the view displays metrics for object records matching the selected object lifecycle and object types, filtered according to the selected process options, filters, and settings.
### Document Lifecycles
You can select a document lifecycle in a Process View from the _Process_ drop-down, and then optionally select one or more document types, subtypes, and classifications that use that lifecycle from the _Subprocess_ dropdown. Process Monitor calculates document process metrics for each steady state version. It groups together all preceding versions after the last steady state version. For example, a process for steady state version 2.0 can include the minor versions 1.1, 1.2, and 1.3.
When running the Process View for a document lifecycle, the view displays metrics for each steady state version matching the selected document lifecycle and document types, filtered according to the selected process options, filters, and settings. The filters are applied to the latest document version in each steady state version.
If a document has been reclassified to a document type that uses a document lifecycle different from the lifecycle selected in the Process View, Process Monitor ignores state change activity for the different lifecycle when calculating metrics or displaying state change information throughout the Process View.
## Creating Process Views
Process Views are individual views for a specific process that show the time it takes for a record or document to move from the start of the process to the end. You can create Process Views, copy them, add them as favorites, and share them with other Vault users the same way as with Vault reports.
### How to Create Process Views
To create a Process View:
1. [Navigate to **Process Monitor**][9] and click **Create**. Vault displays a blank Process View.
2. Click **Edit** () next to the Process View name, enter a **Name** and **Description** for the Process View, and click **Save**.
3. In the [process panel][3] on the left, select an active object or document lifecycle from the **Process** drop-down. Vault populates the _Cycle Time Start_, _Cycle Time End_, _Date_, and _Timeframe_ fields with default values for the selected process.
4. Optional: Select an object type or document type, subtype, or classification that uses the selected process from the **Subprocess** drop-down. You can select up to six subprocesses (up to 255 characters).
5. Select a different **Cycle Time Start** if you want to view data for a cycle time start different from the selected default.
6. Select a different **Cycle Time End** if you want to view data for a cycle time end different from the selected default.
7. Select a different **Date** if you want to view data for a date different from the selected default.
8. Select a different **Timeframe** if you want to view data for a timeframe different from the selected default.
9. Optional: Click the **plus** () icon to add **Additional Filters**:
1. In the **Filters** dialog, select the filter and filter conditions.
2. Click the **plus** () and **minus** () icons to add or remove additional filters as needed.
3. Click **Save** to save and apply the selected filters.
10. Optional: Select **Settings** from the **All Actions** menu to [configure additional settings][2] for the Process View and click **Confirm** to save the settings.
11. Optional: Click **Metrics** to modify which [metrics][4] are displayed on the tables at the top of the Process View.
12. Optional: [Create custom charts][11] in the Process View as needed.
13. Click **Save** to save and run the Process View. Vault updates the Process View to display charts and tables based on the selected process, variants, settings, and metrics.
### How to Create Custom Charts in Process Views {#create-custom-charts}
To create a custom chart in a Process View:
1. While editing the process view, click **+ Chart** to create a custom chart to add to the Process View.
2. In the **Add New Chart** dialog, enter a **Name** for the chart.
3. Select the **Metric** you want to display on the chart.
4. Select a **Group By** value for how you want the data to be grouped on the chart.
5. Select a **Sort By** value for how you want the data to be sorted on the chart.
6. Click **Add Chart**.
7. To edit or delete the chart, select **Edit** or **Delete** from the chart's **Actions** menu.
8. Click **Save** to save the Process View.
### Process Panel {#process-panel}
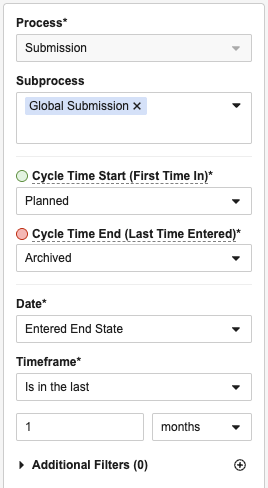
The process panel on the left of the Process View allows you to view different processes, cycle time starts and ends, dates, and timeframes. The following fields are available:
* **Process**: An active object or document lifecycle.
* **Subprocess**: An object type that uses the selected object lifecycle, or a document type, subtype, or classification that uses the selected document lifecycle.
* **Cycle Time Start**: The lifecycle state of the start of the process. By default, the _Cycle Time Start_ uses the first time a record or document entered the selected lifecycle state, but you can change this in the [_Process Monitor Settings_][2] dialog.
* **Cycle Time End**: The lifecycle state of the end of the process. By default, the _Cycle Time End_ uses the most recent time a record or document entered the selected lifecycle state, but you can change this in the [_Process Monitor Settings_][2] dialog.
* **Date**: Date fields on the selected process and subprocess, as well as dates specific to processes, such as _Entered Start State_ or _Entered End State_.
* **Timeframe**: The timeframe for which you want to view records or documents that went through the selected _Process_ based on the selected _Date_.
* **Additional Filters**: Additional standard object field or document field filters that differ depending on the selected _Process_ and _Subprocess_.
## Accessing Process Monitor {#accessing-process-monitor}
In most Vaults, Process Monitor is added automatically to your existing tab configuration. Depending on your Vault's tab configuration, you can access Process Monitor by navigating to **Reporting > Process Monitor**, or by clicking **Process Monitor** directly on the navigation bar. If you need to modify access, you can add the Process Monitor tab to existing tab collections.
You must have the [necessary permissions][1] to view Process Monitor. In addition, Process Monitor is available in all application families except Clinical Data, CRM, and Align.
## Object & Document Processes
Process Monitor allows you to view various metrics about your organization's processes. These processes include both object lifecycles and document lifecycles.
### Object Lifecycles
You can select an object lifecycle in a Process View from the _Process_ drop-down, and then optionally select one or more object types that use that lifecycle from the _Subprocess_ drop-down. When running the Process View, the view displays metrics for object records matching the selected object lifecycle and object types, filtered according to the selected process options, filters, and settings.
### Document Lifecycles
You can select a document lifecycle in a Process View from the _Process_ drop-down, and then optionally select one or more document types, subtypes, and classifications that use that lifecycle from the _Subprocess_ dropdown. Process Monitor calculates document process metrics for each steady state version. It groups together all preceding versions after the last steady state version. For example, a process for steady state version 2.0 can include the minor versions 1.1, 1.2, and 1.3.
When running the Process View for a document lifecycle, the view displays metrics for each steady state version matching the selected document lifecycle and document types, filtered according to the selected process options, filters, and settings. The filters are applied to the latest document version in each steady state version.
If a document has been reclassified to a document type that uses a document lifecycle different from the lifecycle selected in the Process View, Process Monitor ignores state change activity for the different lifecycle when calculating metrics or displaying state change information throughout the Process View.
## Creating Process Views
Process Views are individual views for a specific process that show the time it takes for a record or document to move from the start of the process to the end. You can create Process Views, copy them, add them as favorites, and share them with other Vault users the same way as with Vault reports.
### How to Create Process Views
To create a Process View:
1. [Navigate to **Process Monitor**][9] and click **Create**. Vault displays a blank Process View.
2. Click **Edit** () next to the Process View name, enter a **Name** and **Description** for the Process View, and click **Save**.
3. In the [process panel][3] on the left, select an active object or document lifecycle from the **Process** drop-down. Vault populates the _Cycle Time Start_, _Cycle Time End_, _Date_, and _Timeframe_ fields with default values for the selected process.
4. Optional: Select an object type or document type, subtype, or classification that uses the selected process from the **Subprocess** drop-down. You can select up to six subprocesses (up to 255 characters).
5. Select a different **Cycle Time Start** if you want to view data for a cycle time start different from the selected default.
6. Select a different **Cycle Time End** if you want to view data for a cycle time end different from the selected default.
7. Select a different **Date** if you want to view data for a date different from the selected default.
8. Select a different **Timeframe** if you want to view data for a timeframe different from the selected default.
9. Optional: Click the **plus** () icon to add **Additional Filters**:
1. In the **Filters** dialog, select the filter and filter conditions.
2. Click the **plus** () and **minus** () icons to add or remove additional filters as needed.
3. Click **Save** to save and apply the selected filters.
10. Optional: Select **Settings** from the **All Actions** menu to [configure additional settings][2] for the Process View and click **Confirm** to save the settings.
11. Optional: Click **Metrics** to modify which [metrics][4] are displayed on the tables at the top of the Process View.
12. Optional: [Create custom charts][11] in the Process View as needed.
13. Click **Save** to save and run the Process View. Vault updates the Process View to display charts and tables based on the selected process, variants, settings, and metrics.
### How to Create Custom Charts in Process Views {#create-custom-charts}
To create a custom chart in a Process View:
1. While editing the process view, click **+ Chart** to create a custom chart to add to the Process View.
2. In the **Add New Chart** dialog, enter a **Name** for the chart.
3. Select the **Metric** you want to display on the chart.
4. Select a **Group By** value for how you want the data to be grouped on the chart.
5. Select a **Sort By** value for how you want the data to be sorted on the chart.
6. Click **Add Chart**.
7. To edit or delete the chart, select **Edit** or **Delete** from the chart's **Actions** menu.
8. Click **Save** to save the Process View.
### Process Panel {#process-panel}
The process panel on the left of the Process View allows you to view different processes, cycle time starts and ends, dates, and timeframes. The following fields are available:
* **Process**: An active object or document lifecycle.
* **Subprocess**: An object type that uses the selected object lifecycle, or a document type, subtype, or classification that uses the selected document lifecycle.
* **Cycle Time Start**: The lifecycle state of the start of the process. By default, the _Cycle Time Start_ uses the first time a record or document entered the selected lifecycle state, but you can change this in the [_Process Monitor Settings_][2] dialog.
* **Cycle Time End**: The lifecycle state of the end of the process. By default, the _Cycle Time End_ uses the most recent time a record or document entered the selected lifecycle state, but you can change this in the [_Process Monitor Settings_][2] dialog.
* **Date**: Date fields on the selected process and subprocess, as well as dates specific to processes, such as _Entered Start State_ or _Entered End State_.
* **Timeframe**: The timeframe for which you want to view records or documents that went through the selected _Process_ based on the selected _Date_.
* **Additional Filters**: Additional standard object field or document field filters that differ depending on the selected _Process_ and _Subprocess_.
 ### Process View Settings {#process-view-settings}
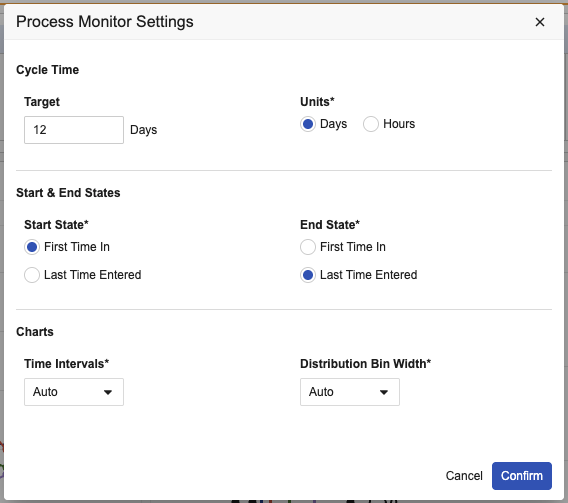
Select **Settings** from the **All Actions** menu on a Process View to configure the settings below. Vault saves these settings at the Process View level and not the user level.
* [**Target**][10]: The manually defined cycle time goal of time for records or documents to spend within the process between the start to end states using the selected _Units_ value (_Days_ or _Hours_).
* **Units**: The units (_Days_ or _Hours_) used to calculate and display the cycle time values.
* **Start State**: Whether the _Cycle Time Start_ is calculated using the first time (_First Time In_) or most recent time (_Last Time Entered_) that a record or document entered the lifecycle start state.
* **End State**: Whether the _Cycle Time End_ is calculated using the first time (_First Time In_) or most recent time (_Last Time Entered_) that a record or document entered the lifecycle end state.
* **Time Intervals**: The time intervals used to display data points on the [Cycle Time Trend chart][7].
* **Distribution Bin Width**: The time range used to display data points on the [Cycle Time Distribution chart][8].
### Process View Settings {#process-view-settings}
Select **Settings** from the **All Actions** menu on a Process View to configure the settings below. Vault saves these settings at the Process View level and not the user level.
* [**Target**][10]: The manually defined cycle time goal of time for records or documents to spend within the process between the start to end states using the selected _Units_ value (_Days_ or _Hours_).
* **Units**: The units (_Days_ or _Hours_) used to calculate and display the cycle time values.
* **Start State**: Whether the _Cycle Time Start_ is calculated using the first time (_First Time In_) or most recent time (_Last Time Entered_) that a record or document entered the lifecycle start state.
* **End State**: Whether the _Cycle Time End_ is calculated using the first time (_First Time In_) or most recent time (_Last Time Entered_) that a record or document entered the lifecycle end state.
* **Time Intervals**: The time intervals used to display data points on the [Cycle Time Trend chart][7].
* **Distribution Bin Width**: The time range used to display data points on the [Cycle Time Distribution chart][8].
 ### Process View Metrics {#process-view-metrics}
The Process View metrics tables display various metrics about the selected process as a whole. You can add up to ten metrics to a Process View.
For document metrics, Process Monitor performs the calculations for each steady state version.
### Process View Metrics {#process-view-metrics}
The Process View metrics tables display various metrics about the selected process as a whole. You can add up to ten metrics to a Process View.
For document metrics, Process Monitor performs the calculations for each steady state version.
 **Cycle Time**
The Cycle Time table displays metrics the time that records or documents spend between the _Cycle Time Start_ state and _Cycle Time End_ state. Only records or documents that entered the end state are included in these calculations.
* **1st Quartile**: The 25th percentile of time records or documents spent between the start and end states.
* **3rd Quartile**: The 75th percentile of time records or documents spent between the start and end states.
* **Average**: The average time records or documents spent between the start and end states.
* **Median**: The median time records or documents spent between the start and end states.
* [**Target**][10]: The target cycle time goal for records or documents to spend within the process between the start to end states.
**Volume**
* **Created**: The total number of unique records or documents created during the selected _Timeframe_. For documents, Process Monitor uses the creation date of the first version in each steady state version.
* **Entered Start State**: The total number of unique records or documents that entered the _Cycle Time Start_ state in the selected _Timeframe_.
* **Entered Start State / Day**: The average number of unique records or documents that entered the _Cycle Time Start_ state per day in the selected _Timeframe_.
* **Entered Start State / Week**: The average number of unique records or documents that entered the _Cycle Time Start_ state per week in the selected _Timeframe_.
* **Entered Start State / Month**: The average number of unique records or documents that entered the _Cycle Time Start_ state per month in the selected _Timeframe_.
* **Entered End State**: The total number of unique records or documents that entered the _Cycle Time End_ state in the selected _Timeframe_.
* **Entered End State / Day**: The average number of unique records or documents that entered the _Cycle Time End_ state per day in the selected _Timeframe_.
* **Entered End State / Week**: The average number of unique records or documents that entered the _Cycle Time End_ state per week in the selected _Timeframe_.
* **Entered End State / Month**: The average number of unique records or documents that entered the _Cycle Time End_ state per month in the selected _Timeframe_.
**Quality**
* **Completed Late**: The number of records or documents where the time between the start and end states is greater than the specified _Target_.
* **Completed Late %**: The percentage of records or documents where the time between the start and end states is greater than the specified _Target_.
* **Completed on Time**: The number of records or documents where the time between the start and end states is less than the specified _Target_.
* **Completed on Time %**: The percentage of records or documents where the time between the start and end states is less than the specified _Target_.
* **First Time Right %**: The percentage of records or documents that did not repeat any lifecycle states.
* **Number of Variants**: The total number of unique process paths.
* **Total First Time Right**: The total number of records or documents that did not repeat any lifecycle states.
* **Total with Rework**: The total number of records or documents that repeated one or more lifecycle states.
#### How to Edit Process View Metrics
To edit which metrics are displayed:
1. Click **Metrics**.
2. In the **Edit Metrics** dialog, select the metrics you want to add or remove from the tables and click the **move left** () and **move right** () arrows to move them between the **Available Metrics** and **Selected Metrics** lists.
3. To reorder the metrics, select the metrics you want to move on the **Selected Metrics** list and click the **move up** (), **move down** (), **move to top** (), and **move to bottom** () arrows to move them to the position you want.
4. Click **Save** to save the selected metrics, and click **Run** to update the data on the metrics tables.
### Process View Target {#target}
You can specify a _Target_ for a Process View, which is a cycle time goal for records or documents to spend between the start and end states of the selected process. Vault uses the specified _Target_ value to calculate the metrics for Completed Late (count and percentage) and Completed on Time (count and percentage). You must [configure a _Target_ value][2] for Vault to calculate these metrics.
For example, if you want to target 10 days for records to progress through the process from start to finish, enter **10** for the **Target**, and select **Days** for the **Unit**. Out of 20 total records in the specified _Timeframe_, 17 entered the end state within 10 days, and 3 entered the end state after 10 days. Vault calculates the metrics as follows:
* **Completed on Time**: 17
* **Completed on Time %**: 85%
* **Completed Late**: 3
* **Completed Late %**: 15%
## Viewing Process Views
[Navigate to **Process Monitor**][9] to view a list of Process Views to which you have access.
### Process Views & Favorites
The Process Monitor tab displays several views:
* **All Process Views**: Lists all Process Views in the Vault for which you are an _Owner_, _Viewer_, or _Editor_. All other views are subsets of this view.
* **Recent Process Views**: Lists the last 20 Process Views that you viewed, edited, or created.
* **Favorites**: Lists Process Views that you have marked as a favorite by clicking the **Favorite** () icon.
When viewing _All Process Views_, you can also use search and filters and edit the column layout to create additional custom views. Click **Save View As** to save this view to your _Views_ panel.
### How to View a Process View
To view a Process View:
1. In Process Monitor, click the **Name** of the Process View you want to view. Vault runs the selected Process View and displays the cycle time charts in the _Overview_ tab.
2. Optional: Modify the _Subprocess_, _Cycle Time Start_, _Cycle Time End_, _Date_, and _Timeframe_ in the [process panel][3] as needed and click **Run** to update the Process View.
3. Optional: Select **Settings** from the **All Actions** menu to [configure additional settings][2] for the Process View, click **Confirm** to save the settings, and click **Run** to update the Process View.
4. Optional: Click **Metrics** to modify which [metrics][4] are displayed on the tables at the top of the Process View, and click **Run** to update the Process View.
5. Click the [**Overview** tab][6] to view cycle time trend and distribution charts for the selected process. Hover over a data point on the chart to view additional information chart data.
6. Click the [**Process Graph** tab][5] to view a flowchart of the lifecycle states in the selected process. Hover over a lifecycle state the view additional information about how long records or documents were in that state.
### Process Monitor Performance
Process Monitor performs advanced computations on your data. These computations take longer based on the number of records or documents that qualify for the Process View configuration, as well as the complexity of the process you are analyzing. Depending on how many steps and variants are in your process, a single Process Monitor run can typically analyze between 500 and 4,500 records or documents per second. A Process Monitor run will time out after 30 minutes.
The first time anyone in your Vault runs a saved Process View for a given process, it will take longer to run. Subsequent runs will be faster because Vault reuses some computations.
If your Process Monitor run is taking too long, shorten the _Timeframe_ selection or apply additional filters to reduce the number of records or documents being analyzed.
## Overview Tab {#overview-tab}
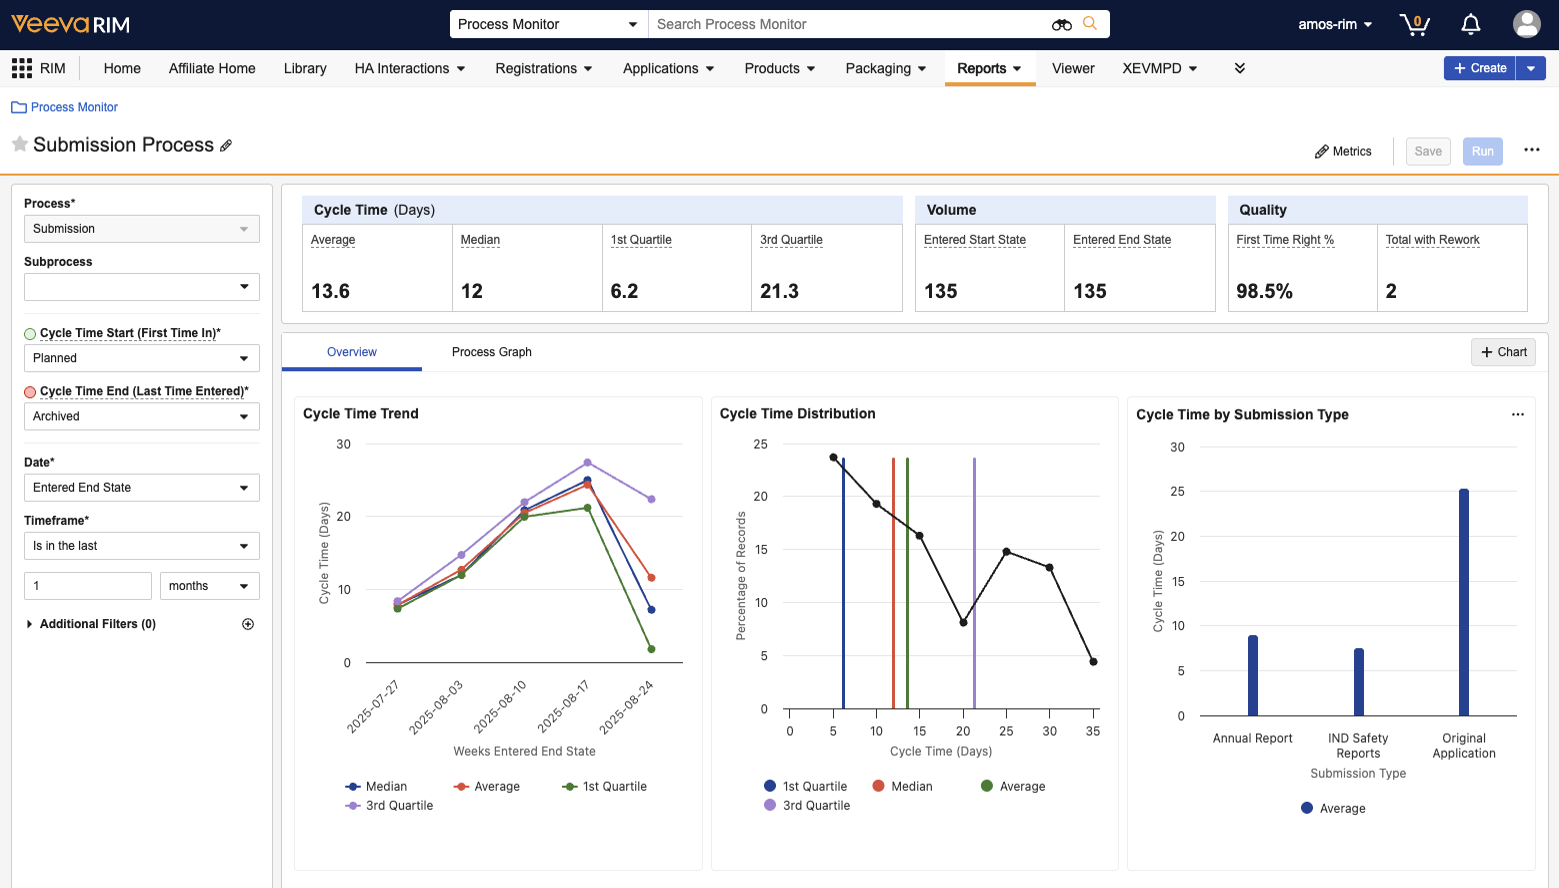
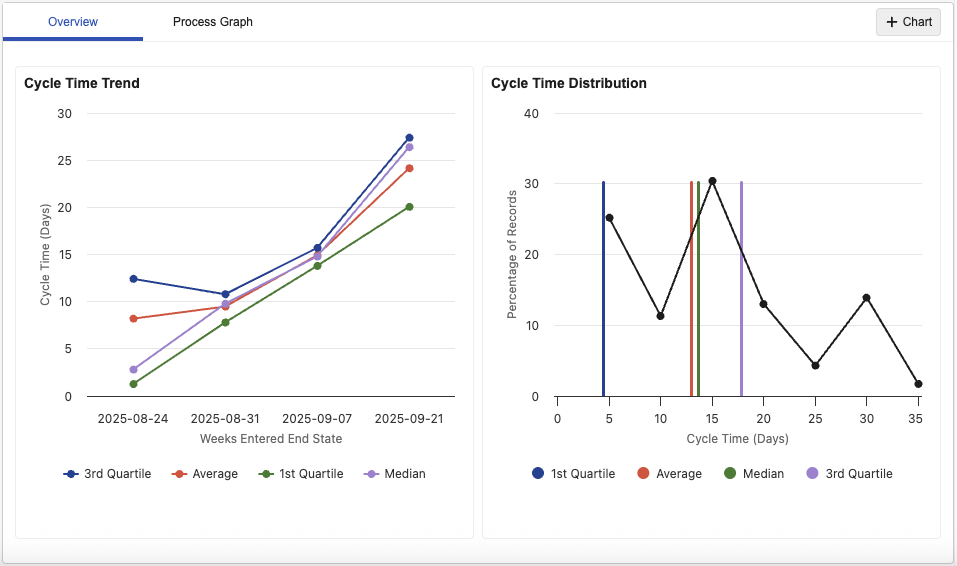
The Overview tab displays the Cycle Time Trend chart, the Cycle Time Distribution chart, and any other custom charts added to the Process View.
**Cycle Time**
The Cycle Time table displays metrics the time that records or documents spend between the _Cycle Time Start_ state and _Cycle Time End_ state. Only records or documents that entered the end state are included in these calculations.
* **1st Quartile**: The 25th percentile of time records or documents spent between the start and end states.
* **3rd Quartile**: The 75th percentile of time records or documents spent between the start and end states.
* **Average**: The average time records or documents spent between the start and end states.
* **Median**: The median time records or documents spent between the start and end states.
* [**Target**][10]: The target cycle time goal for records or documents to spend within the process between the start to end states.
**Volume**
* **Created**: The total number of unique records or documents created during the selected _Timeframe_. For documents, Process Monitor uses the creation date of the first version in each steady state version.
* **Entered Start State**: The total number of unique records or documents that entered the _Cycle Time Start_ state in the selected _Timeframe_.
* **Entered Start State / Day**: The average number of unique records or documents that entered the _Cycle Time Start_ state per day in the selected _Timeframe_.
* **Entered Start State / Week**: The average number of unique records or documents that entered the _Cycle Time Start_ state per week in the selected _Timeframe_.
* **Entered Start State / Month**: The average number of unique records or documents that entered the _Cycle Time Start_ state per month in the selected _Timeframe_.
* **Entered End State**: The total number of unique records or documents that entered the _Cycle Time End_ state in the selected _Timeframe_.
* **Entered End State / Day**: The average number of unique records or documents that entered the _Cycle Time End_ state per day in the selected _Timeframe_.
* **Entered End State / Week**: The average number of unique records or documents that entered the _Cycle Time End_ state per week in the selected _Timeframe_.
* **Entered End State / Month**: The average number of unique records or documents that entered the _Cycle Time End_ state per month in the selected _Timeframe_.
**Quality**
* **Completed Late**: The number of records or documents where the time between the start and end states is greater than the specified _Target_.
* **Completed Late %**: The percentage of records or documents where the time between the start and end states is greater than the specified _Target_.
* **Completed on Time**: The number of records or documents where the time between the start and end states is less than the specified _Target_.
* **Completed on Time %**: The percentage of records or documents where the time between the start and end states is less than the specified _Target_.
* **First Time Right %**: The percentage of records or documents that did not repeat any lifecycle states.
* **Number of Variants**: The total number of unique process paths.
* **Total First Time Right**: The total number of records or documents that did not repeat any lifecycle states.
* **Total with Rework**: The total number of records or documents that repeated one or more lifecycle states.
#### How to Edit Process View Metrics
To edit which metrics are displayed:
1. Click **Metrics**.
2. In the **Edit Metrics** dialog, select the metrics you want to add or remove from the tables and click the **move left** () and **move right** () arrows to move them between the **Available Metrics** and **Selected Metrics** lists.
3. To reorder the metrics, select the metrics you want to move on the **Selected Metrics** list and click the **move up** (), **move down** (), **move to top** (), and **move to bottom** () arrows to move them to the position you want.
4. Click **Save** to save the selected metrics, and click **Run** to update the data on the metrics tables.
### Process View Target {#target}
You can specify a _Target_ for a Process View, which is a cycle time goal for records or documents to spend between the start and end states of the selected process. Vault uses the specified _Target_ value to calculate the metrics for Completed Late (count and percentage) and Completed on Time (count and percentage). You must [configure a _Target_ value][2] for Vault to calculate these metrics.
For example, if you want to target 10 days for records to progress through the process from start to finish, enter **10** for the **Target**, and select **Days** for the **Unit**. Out of 20 total records in the specified _Timeframe_, 17 entered the end state within 10 days, and 3 entered the end state after 10 days. Vault calculates the metrics as follows:
* **Completed on Time**: 17
* **Completed on Time %**: 85%
* **Completed Late**: 3
* **Completed Late %**: 15%
## Viewing Process Views
[Navigate to **Process Monitor**][9] to view a list of Process Views to which you have access.
### Process Views & Favorites
The Process Monitor tab displays several views:
* **All Process Views**: Lists all Process Views in the Vault for which you are an _Owner_, _Viewer_, or _Editor_. All other views are subsets of this view.
* **Recent Process Views**: Lists the last 20 Process Views that you viewed, edited, or created.
* **Favorites**: Lists Process Views that you have marked as a favorite by clicking the **Favorite** () icon.
When viewing _All Process Views_, you can also use search and filters and edit the column layout to create additional custom views. Click **Save View As** to save this view to your _Views_ panel.
### How to View a Process View
To view a Process View:
1. In Process Monitor, click the **Name** of the Process View you want to view. Vault runs the selected Process View and displays the cycle time charts in the _Overview_ tab.
2. Optional: Modify the _Subprocess_, _Cycle Time Start_, _Cycle Time End_, _Date_, and _Timeframe_ in the [process panel][3] as needed and click **Run** to update the Process View.
3. Optional: Select **Settings** from the **All Actions** menu to [configure additional settings][2] for the Process View, click **Confirm** to save the settings, and click **Run** to update the Process View.
4. Optional: Click **Metrics** to modify which [metrics][4] are displayed on the tables at the top of the Process View, and click **Run** to update the Process View.
5. Click the [**Overview** tab][6] to view cycle time trend and distribution charts for the selected process. Hover over a data point on the chart to view additional information chart data.
6. Click the [**Process Graph** tab][5] to view a flowchart of the lifecycle states in the selected process. Hover over a lifecycle state the view additional information about how long records or documents were in that state.
### Process Monitor Performance
Process Monitor performs advanced computations on your data. These computations take longer based on the number of records or documents that qualify for the Process View configuration, as well as the complexity of the process you are analyzing. Depending on how many steps and variants are in your process, a single Process Monitor run can typically analyze between 500 and 4,500 records or documents per second. A Process Monitor run will time out after 30 minutes.
The first time anyone in your Vault runs a saved Process View for a given process, it will take longer to run. Subsequent runs will be faster because Vault reuses some computations.
If your Process Monitor run is taking too long, shorten the _Timeframe_ selection or apply additional filters to reduce the number of records or documents being analyzed.
## Overview Tab {#overview-tab}
The Overview tab displays the Cycle Time Trend chart, the Cycle Time Distribution chart, and any other custom charts added to the Process View.
 ### Cycle Time Trend Chart {#cycle-time-trend-chart}
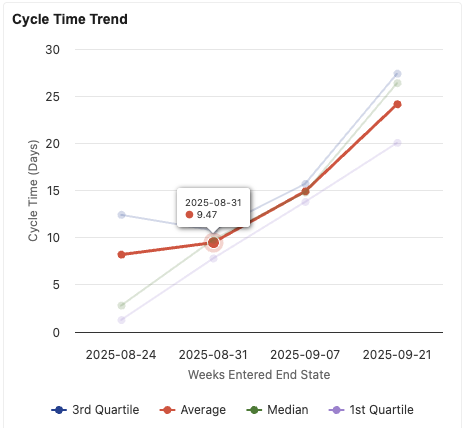
The Cycle Time Trend chart displays trending lines for each of the cycle time metrics (average, median, and so on) with data points for the number of days it took for records or documents to reach the end state for each time interval. To modify the time interval displayed on the Cycle Time Trend chart, select a different [**Time Intervals**][2] value in the _Process Monitor Settings_ dialog.
In the example below, _Time Intervals_ is set to _Weeks_. Records took an average of 8.2 days to reach the end state the week of August 8, 2025, 9.47 days to reach the end state the week of August 31, 2025, 14.91 days to reach the end state the week of September 7, 2025, and so on.
### Cycle Time Trend Chart {#cycle-time-trend-chart}
The Cycle Time Trend chart displays trending lines for each of the cycle time metrics (average, median, and so on) with data points for the number of days it took for records or documents to reach the end state for each time interval. To modify the time interval displayed on the Cycle Time Trend chart, select a different [**Time Intervals**][2] value in the _Process Monitor Settings_ dialog.
In the example below, _Time Intervals_ is set to _Weeks_. Records took an average of 8.2 days to reach the end state the week of August 8, 2025, 9.47 days to reach the end state the week of August 31, 2025, 14.91 days to reach the end state the week of September 7, 2025, and so on.
 ### Cycle Time Distribution Chart
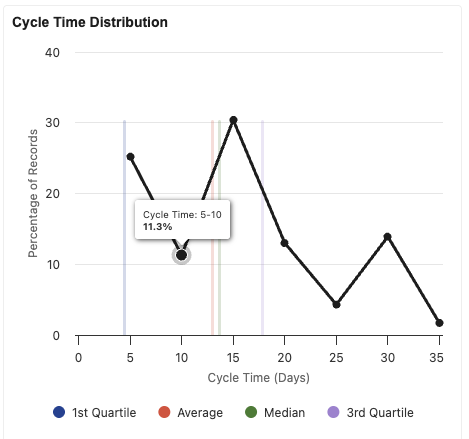
The Cycle Time Distribution chart displays a line with the percentage of records or documents that reached the end state within a range of days (or other time unit). The chart also displays vertical lines for each of the cycle time metrics for comparison. To modify the time unit displayed on the Cycle Time Distribution chart, select a different [**Distribution Bin Width**][2] value in the _Process Monitor Settings_ dialog.
In the example below, the _Distribution Bin Width_ is set to _5_, so each data point includes records that reached the end state within five-day periods. 25.2% of records reached the end state within 0-5 days, 11.3% of records reached the end state within 5-10 days, 30.4% of the records reached the end state within 10-15 days, and so on.
### Cycle Time Distribution Chart
The Cycle Time Distribution chart displays a line with the percentage of records or documents that reached the end state within a range of days (or other time unit). The chart also displays vertical lines for each of the cycle time metrics for comparison. To modify the time unit displayed on the Cycle Time Distribution chart, select a different [**Distribution Bin Width**][2] value in the _Process Monitor Settings_ dialog.
In the example below, the _Distribution Bin Width_ is set to _5_, so each data point includes records that reached the end state within five-day periods. 25.2% of records reached the end state within 0-5 days, 11.3% of records reached the end state within 5-10 days, 30.4% of the records reached the end state within 10-15 days, and so on.
 ## Process Graph Tab {#process-graph-tab}
The Process Graph tab displays a flowchart of the lifecycle states in the selected process.
## Process Graph Tab {#process-graph-tab}
The Process Graph tab displays a flowchart of the lifecycle states in the selected process.
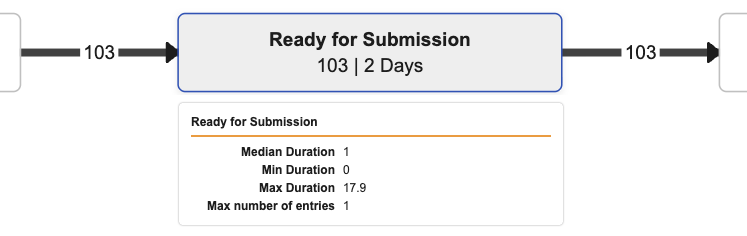
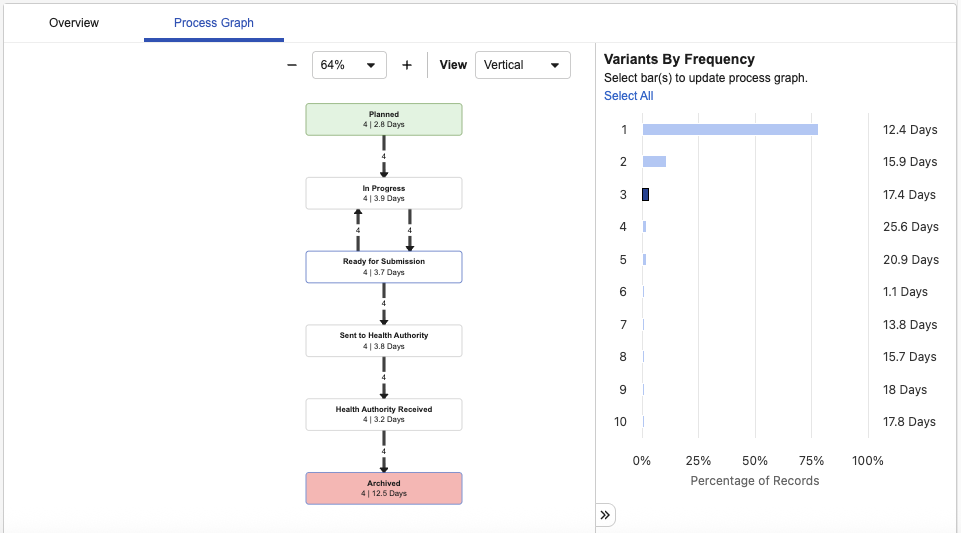 Each lifecycle state on the flowchart displays the name of the lifecycle state, the number of records or documents that transitioned through the state, and the average time all records or documents spent in that state. Arrows are displayed to the left and right of the lifecycle state that indicate the number of records or documents that entered the state and exited the state. Hover over a lifecycle state to view information about how long the records or documents were in that state, including the median duration, minimum duration, maximum duration, and maximum number of times a record or document entered that state.
 If a document has been reclassified to a document type that uses a document lifecycle different from the lifecycle selected in the Process View, Process Monitor ignores state change activity for the different lifecycle when displaying state change information in the _Process Graph_ tab.
### Variants By Frequency Panel
The _Variants By Frequency_ panel on the right of the _Process Graph_ tab displays a bar for each variant of the selected process. A single lifecycle may have several paths (variants) for a record or document to progress through the lifecycle. For example, one record may start in the _Planned_ state and transition directly to the _Approved_ state, while another record may start in _Planned_, transition to _In Review_, and then transition to _Approved_. Each variant of the lifecycle is displayed as its own bar on the _Variants By Frequency_ panel. The average time a record or document takes to transition from the _Cycle Time Start_ state to the _Cycle Time End_ state is displayed to the right of each variant bar.
If a document has been reclassified to a document type that uses a document lifecycle different from the lifecycle selected in the Process View, Process Monitor ignores state change activity for the different lifecycle when displaying state change information in the _Process Graph_ tab.
### Variants By Frequency Panel
The _Variants By Frequency_ panel on the right of the _Process Graph_ tab displays a bar for each variant of the selected process. A single lifecycle may have several paths (variants) for a record or document to progress through the lifecycle. For example, one record may start in the _Planned_ state and transition directly to the _Approved_ state, while another record may start in _Planned_, transition to _In Review_, and then transition to _Approved_. Each variant of the lifecycle is displayed as its own bar on the _Variants By Frequency_ panel. The average time a record or document takes to transition from the _Cycle Time Start_ state to the _Cycle Time End_ state is displayed to the right of each variant bar.
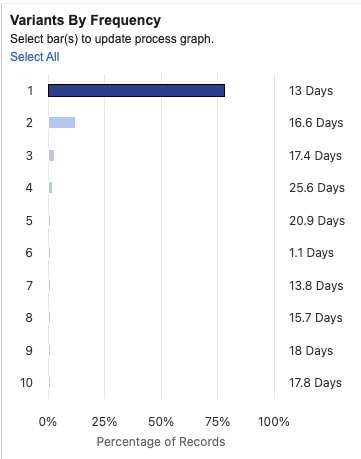 To view the flowchart for a specific lifecycle variant, click its **variant bar** on the **Variants By Frequency** panel. To view the entire flowchart for all lifecycle variants, click **Select All**. Click the **plus** (**+**) icon and **minus** (**-**) icon to zoom in and out on the lifecycle flowchart. Select **Horizontal** or **Vertical** from the **View** drop-down to view the lifecycle flowchart in a horizontal or vertical layout.
## Exporting Process View Records or Documents {#export}
You can export a list of records or documents in a Process View to a .TXT or .CSV file. You can export all records or documents in the Process View, or export the records or documents for a specific lifecycle state or state transition. Whether Process Monitor exports to .TXT or .CSV depends on whether your Vault is configured for multilingual document handling.
### How to Export All Process View Records or Documents
To export all records or documents in a Process View:
1. In the Process View, select **Text/CSV** from the **All Actions** menu.
2. In the _Select Columns to Export_ dialog, click **Export** to export the records or documents using the columns in the default list view configuration, or modify the columns you want to export and rerun the view by clicking **Run + Export**. Vault generates a .TXT or .CSV file with a list of all records or documents in the Process View.
3. Optional: If you modified the columns and clicked **Run + Export**, you can click **Save** in the Process View to save your changes to the selected columns.
### How to Export Records or Documents in a Specific Lifecycle State
To export records or documents in a specific lifecycle state:
1. In the _Process Graph_ tab, select one or more variants on the _Variants by frequency_ panel.
2. Hover over a lifecycle state or state transition arrow on the process graph to display a hovercard with information about the state or transition.
3. Click **Export** on the hovercard. Vault generates a .TXT or .CSV file with a list of the records or documents in the lifecycle state or state transition using the current list view columns. You cannot modify which columns you want to export when exporting records from a hovercard.
## Related Permissions {#permissions}
The ability to view a Process View is determined by object-level, field-level, and record-level permissions, document permissions, and Atomic Security. If a user has access to view a record or steady state version, the Process Graph shows all state changes for the record or steady state version, regardless of Atomic Security settings.
Users with the _Vault Owner_, _System Administrator_, or _Business Administrator_ security profiles are automatically granted permissions to read and edit all Process Views through the _Process Monitor Administrators_ system-provided group.
The following permissions control your ability to use Process Monitor:
| Type | Permission Label | Controls |
| --- | --- | --- |
| Security Profile | Tabs: Process Monitor: View | Ability to view the _Process Monitor_ tab. Must be enabled in conjunction with the _Pages: Process Monitor: View_ preference. |
| Security Profile | Pages: Process Monitor: View | Ability to view the _Process Monitor_ tab. Must be enabled in conjunction with the _Tabs: Process Monitor: View_ preference. |
| Security Profile | Objects: Process View: Read | Ability to view Process Views within Process Monitor. |
| Security Profile | Objects: Process View: Create, Edit, Delete | Ability to create, edit, and delete Process Views. |
| Security Profile | Objects: \[Object\]: Read | Ability to select processes for the specified object when creating a Process View, and ability to view a Process View for the specified process. |
| Document Role | View Document | Ability to select processes and subprocesses for a document lifecycle and document type, and ability to view a Process View for the specified process and subprocess.
To view the flowchart for a specific lifecycle variant, click its **variant bar** on the **Variants By Frequency** panel. To view the entire flowchart for all lifecycle variants, click **Select All**. Click the **plus** (**+**) icon and **minus** (**-**) icon to zoom in and out on the lifecycle flowchart. Select **Horizontal** or **Vertical** from the **View** drop-down to view the lifecycle flowchart in a horizontal or vertical layout.
## Exporting Process View Records or Documents {#export}
You can export a list of records or documents in a Process View to a .TXT or .CSV file. You can export all records or documents in the Process View, or export the records or documents for a specific lifecycle state or state transition. Whether Process Monitor exports to .TXT or .CSV depends on whether your Vault is configured for multilingual document handling.
### How to Export All Process View Records or Documents
To export all records or documents in a Process View:
1. In the Process View, select **Text/CSV** from the **All Actions** menu.
2. In the _Select Columns to Export_ dialog, click **Export** to export the records or documents using the columns in the default list view configuration, or modify the columns you want to export and rerun the view by clicking **Run + Export**. Vault generates a .TXT or .CSV file with a list of all records or documents in the Process View.
3. Optional: If you modified the columns and clicked **Run + Export**, you can click **Save** in the Process View to save your changes to the selected columns.
### How to Export Records or Documents in a Specific Lifecycle State
To export records or documents in a specific lifecycle state:
1. In the _Process Graph_ tab, select one or more variants on the _Variants by frequency_ panel.
2. Hover over a lifecycle state or state transition arrow on the process graph to display a hovercard with information about the state or transition.
3. Click **Export** on the hovercard. Vault generates a .TXT or .CSV file with a list of the records or documents in the lifecycle state or state transition using the current list view columns. You cannot modify which columns you want to export when exporting records from a hovercard.
## Related Permissions {#permissions}
The ability to view a Process View is determined by object-level, field-level, and record-level permissions, document permissions, and Atomic Security. If a user has access to view a record or steady state version, the Process Graph shows all state changes for the record or steady state version, regardless of Atomic Security settings.
Users with the _Vault Owner_, _System Administrator_, or _Business Administrator_ security profiles are automatically granted permissions to read and edit all Process Views through the _Process Monitor Administrators_ system-provided group.
The following permissions control your ability to use Process Monitor:
| Type | Permission Label | Controls |
| --- | --- | --- |
| Security Profile | Tabs: Process Monitor: View | Ability to view the _Process Monitor_ tab. Must be enabled in conjunction with the _Pages: Process Monitor: View_ preference. |
| Security Profile | Pages: Process Monitor: View | Ability to view the _Process Monitor_ tab. Must be enabled in conjunction with the _Tabs: Process Monitor: View_ preference. |
| Security Profile | Objects: Process View: Read | Ability to view Process Views within Process Monitor. |
| Security Profile | Objects: Process View: Create, Edit, Delete | Ability to create, edit, and delete Process Views. |
| Security Profile | Objects: \[Object\]: Read | Ability to select processes for the specified object when creating a Process View, and ability to view a Process View for the specified process. |
| Document Role | View Document | Ability to select processes and subprocesses for a document lifecycle and document type, and ability to view a Process View for the specified process and subprocess.
Users must have _View Document_ permissions for at least one steady state version that uses the related lifecycle and document type to allow them to select the process and subprocess, and to view the Process View for the process and subprocess. Steady state versions the user does not have access to are not displayed in the Process View. |
[1]: #permissions
[2]: #process-view-settings
[3]: #process-panel
[4]: #process-view-metrics
[5]: #process-graph-tab
[6]: #overview-tab
[7]: #cycle-time-trend-chart
[8]: #cycle-time-distribution-chart
[9]: #accessing-process-monitor
[10]: #target
[11]: #create-custom-charts